Crop scouts from around the world set out on an annual tour the third week of August to gauge the potential of the 2019 U.S. soybean crop. One group covered the western Corn Belt to tour South Dakota, Nebraska, western Iowa and southern Minnesota, while a second group focused on the eastern Corn Belt and began in Ohio before moving west into Indiana, Illinois, eastern Iowa, also finishing in southern Minnesota. Combined, the tour collected roughly 1,500 samples of U.S. soybean fields from seven states representing roughly 70% of annual production.
In general, the tour found fewer pod counts and variable plant development and soil moisture levels in soybean fields compared with last year’s results. Plants’ height varied based on area as wet conditions provided some farmers with only brief periods to seed their soybean crops in less-than-ideal condition. In some cases, low-lying areas of the fields remained underwater after planting, which kept plants from emerging. These blank spots resulted in areas of variable plant populations that will add to the inconsistency of yields, and potentially higher levels of abandonment in some cases, when combines begin to roll later this fall.
Samples from the tour did not result in actual soybean yield calculations, but instead provided insight for each state as to the stage of development of the plant, soil moisture conditions, plant count and number of pods to gauge the potential of the 2019 crop. These factors were aggregated on a state-level and were used to provide comparisons to previous years. For example, pod counts in 2018’s largest soybean-producing state, Illinois, were projected to be down 26.54% compared with last year and were seen 24.13% lower than the previous three-year average. The U.S. Department of Agriculture (USDA), in its August update, projected the state’s soybean yield to slip nearly 15.4% from 2018. Although final yield reflects more information, such as the number of beans per pod and the final pod weight, the calculations provide an idea of the yield potential for a given crop.
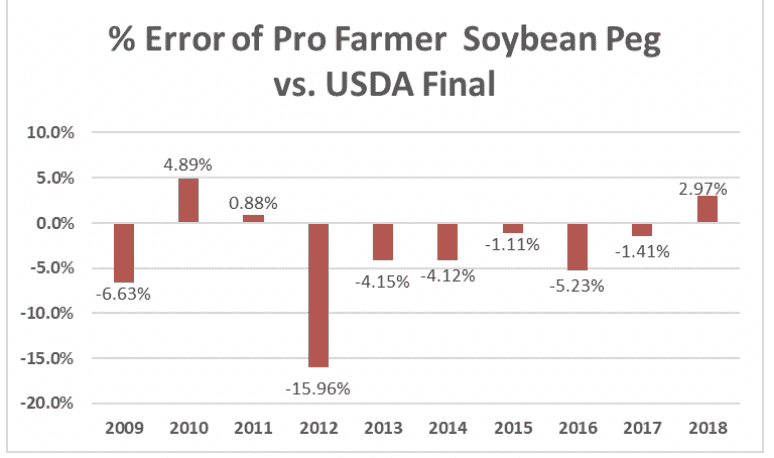
Following the conclusion of the tour, the group released its projection for the 2019 U.S. soybean crop for the national crop. U.S. soybean output was seen off 23.05% from 2018 while USDA is projecting for a decline of 19.0%. It is important to note that the group’s projections tend to be more accurate in years when the soybean crop is further advanced. That is certainly not the case in 2019, as well-documented planting delays have plagued much of the major soybean-producing regions. A look at recent history suggests that the group’s estimate has fallen below USDA’s final January estimate in seven of the last 10 years. The group’s 2018 projection exceeded USDA’s final estimate by 2.97%.
In addition to highlighting the variability and lower pod counts in the 2019 U.S. soybean crop, the tour also emphasized the importance of an extended growing season to help support maximizing the current yield potential. For many areas in the northern Plains, the typical first frost date approaches in September, while other areas tend to see their first frost date in late October or early November. According to research published by North Dakota State University’s Extension Agronomist, soybean tops are damaged when temperatures fall at or just below freezing creating a frost, while extended periods at lower temperatures, or a freeze, can completely kill the plant. This will make the extended temperature outlook increasingly more importance for the market as soybean plants look to optimize their current yield potential.