
A major challenge in the soybean commodity sector is the lack of a single variable that best describes soybean meal quality. The Wisconsin Soybean Extension Program set out to develop a soybean meal swine nutrition case study to (1) develop a model that precisely estimates soybean meal value specific for optimizing swine nutrition based on synthetic or hypothetical soybean meal derived from soybean quality parameters, (2) quantify the swine-feeding-specific soybean meal value variability within and among all soybean-producing states, and (3) evaluate the predictive effectiveness of the model for estimating soybean meal value.
In a bean pod…
- By considering meal protein content and the concentrations of four essential amino acids (lysine, methionine, tryptophan, and isoleucine), a precise estimate of soybean meal value was obtained.
- The developed model allows soybean producers, elevators, and processors to estimate the relative cultivar-specific soybean meal value for swine nutrition.
- A large soybean meal value range was observed within each state, which was attributed to genetic, management and environmental differences.
- There was no relationship between soybean seed yield and soybean meal value, which shows that cultivar selection for increased soybean meal value among the highest-yielding cultivars can maximize the value of an individual farmer’s soybean crop.
Introduction
Soybean [Glycine max (L.) Merr.] is the most important oilseed crop in the U.S., grown mainly as a protein and oil source for animal and human consumption. Upon seed delivery, elevators do not typically analyze soybean seed for quality; however, end- user processors do. The quality characteristics of soybean meal (SBM) can ultimately affect the local soybean per ton price offered to soybean producers after soybean processors begin to receive and valuate the new crop soybean seed. Soybean meal is commonly used as feed source for non-ruminant species (swine) due to its high protein concentration, excellent amino acid (AA) profile and adequate supply (Cromwell, 2000). However, substantial variation in SBM composition has been observed among meals produced in different countries or areas within a country (Lagos and Stein, 2017). The location of U.S. production thus appears to have a great influence on soybean seed as a result of cultivar selection and weather and therefore, by extension to meal composition as well.
Region-specific agricultural management, in-season weather conditions, and their interactions greatly affect soybean seed yield and composition (Mourtzinis et al., 2017), which in turn can affect SBM composition. Many underlying weather and environmental factors have been suggested to explain this variation, including in-season temperature variance (Yaklich and Vinyard, 2004). The effect of temperature on seed composition is especially pronounced during seed fill (Kane et al., 1997), and particularly so from R5 to R8 (Mourtzinis et al., 2017). Obviously, compositional differences, as shaped by environmental and management factors, ultimately affect seed and meal composition and amino acid balance. The resultant SBM value will thus vary and can potentially affect the per bushel price offered locally, regionally, and nationally each year.
By knowing which cultivars produce higher yields and higher quality SBM, U.S. producers can better compete in the world soybean market by responding to intrinsic or explicit pricing premiums/discounts offered by soybean seed purchasers. Due to the aforementioned genetic × environment effect on soybean seed composition, the need to identify cultivars that produce meal with desirable composition, but with no concurrent reduction in yield is essential. However, doing so requires analysis of a large number of samples each year in each locality but such estimation would be costly and time-consuming. We argue that a fast, precise, and cost-effective method of estimation would be valuable for producers, nutritionists, local elevators and regional soybean processors. Therefore, using SBM for swine nutrition as a case-study, our objectives in this study were to (1) develop a model that precisely estimates SBM value specific for optimizing swine nutrition based on synthetic or hypothetical SBM derived from soybean quality parameters, (2) quantify the swine-feeding-specific SBM value variability within and among all soybean-producing states, and (3) evaluate the predictive effectiveness of the model for estimating SBM value.
Materials and Methods
Data description and compositional analysis
From 2013 to 2016, a total of 8,282 soybean samples were collected from 29 states (Iowa, Kansas, Minnesota, Missouri, Nebraska, North Dakota, South Dakota, Illinois, Indiana, Michigan, Ohio, Wisconsin, Delaware, Maryland, New Jersey, New York, Pennsylvania, Virginia, Arkansas, Kentucky, Louisiana, Mississippi, Oklahoma, Tennessee, Texas, Alabama, Georgia, North Carolina, and South Carolina). Samples were analyzed for protein, oil, and for seven essential amino acids (AAs) which were lysine (Lys), methionine (Meth), tryptophan (Tryp), isoleucine (Iso) cysteine (Cys), threonine (Thr), and valine (Val). The modeled SBM for all 8,282 soybean samples was created using the United Soybean Board Estimated Processed Value calculator (Brumm and Hurburgh, 1990).
Model to estimate soybean meal value
The current major challenge in the soybean commodity sector is the lack of a single variable that best describes SBM quality. Although it is widely accepted that the greater the protein content the greater the value of the meal, it is not clear as to how oil content and the relative proportions of the seven essential AAs — Lys, Cys, Meth, Thr, Tryp, Iso, and Val — affect SBM value. To overcome this problem, we used principal component analysis (PCA), which is a multivariate dimension reduction technique, to combine the information of all the sample-specific constituents (protein, oil, AA) of the synthetic/hypothetical SBM into one variable (Y_pca). The 8,282 samples were then ranked in descending Y_pca value and a representative subset (n=145) was specifically selected and used in Dalex least cost formulation program (Dalex Livestock Solutions, LLC) to determine the least cost mix of ration ingredients.
To develop a model that precisely estimates SBM value ($ ton-1), multiple linear regression was applied to 110 out of the 145 samples for model calibration. Protein, oil, Lys, Cys, Meth, Thre, Tryp, Iso, and Val meal concentrations were used as independent variables. The final model (Equation 1) included protein, Lys, Meth, Tryp, and Iso as the five independent variables. Units of independent variables were presented as percent on a dry basis. That model provided a good fit to data of the 110 cultivar samples in view of the calibration R2 and adjusted R2=0.991, RMSE=1.76 and CV=0.5.
Equation 1: Value ($) of SBM ton-1 = 72.16361 + 1.65587 × Protein + 27.24420 × Lys + 57.25507 × Meth + 84.56061 × Tryp + 21.80598 × Iso
Results and Discussion
Model performance
The predictive reliability of the model was evaluated using the 35 samples (Figure 1) that were not included in the model calibration process. Actual versus fitted values were closely correlated with R2=0.99. These validation results suggested that the calibrated model can precisely estimate SBM value of seed soybean produced by cultivars grown in any year and in any locality in the U.S. based on fixed ingredient prices, thereby precluding the need to go to the expense and time of completing the process of a least cost formula for each soybean sample.
To examine the relationship between soybean seed yield and hypothetical SBM value, we used compositional and seed yield data from an independent data set (from Mourtzinis et al., 2017). Results show that there is no strong relationship between seed yield and protein content but there is a strong relationship between protein and SBM value (Figure 2A). Additionally, there is no relationship between soybean seed yield and SBM value (Figure 2B), which shows that cultivar selection for increased SBM value among the highest-yielding cultivars can maximize the value of an individual farmers soybean crop.

Farmers typically select cultivars among those that seed companies promote and advertise as the highest-yielding. Application of our simple model (Equation 1), allows any producer, elevator, or processor to estimate the value based on fixed ingredient prices of swine-based SBM for any specific soybean seed sample. Additionally, cultivars can be compared for their hypothetical SBM values, which can aid the producer when selecting cultivars to plant in a given year and thus result in a mechanism for elevators and processors to offer a premium or discount based on the estimated SBM value. This same technique, based on fixed ingredient prices, can also be applied by plant breeders during the selection phase of cultivar breeding and release programs.
Estimating soybean meal value variability
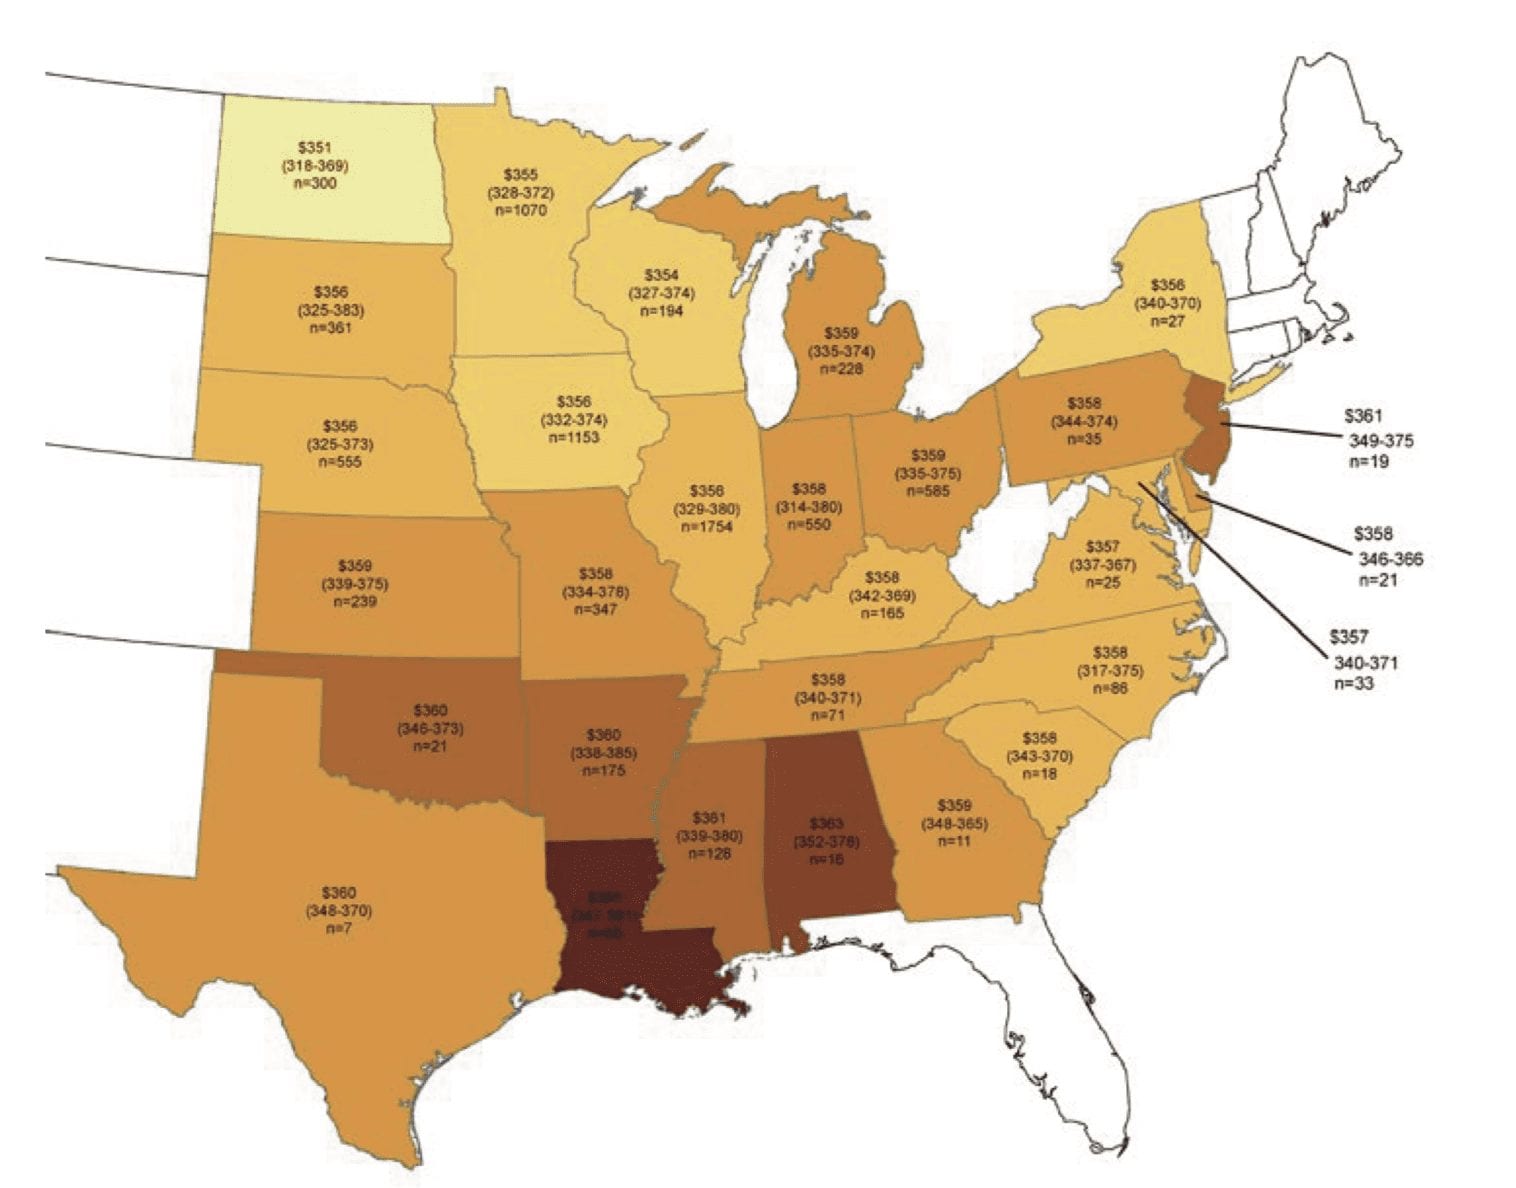
Mapping the SBM values ($ ton-1), as estimated by applying our model (Equation 1), revealed substantial monetary differences among the 29 states (Figure 3). On aver- age, soybean seed harvested in northern states produced SBM values up to $15 ton-1 lower than in southern states. Assuming amino acid digestibility is consistent across regions, our model confirms that Southern U.S. producers harvest soybean seeds with greater SBM quality than Northern U.S. producers as has been documented in the prior literature.
Another important finding is the large SBM value range within each state, which was attributed to genetic, management, and environmental differences (Figure 3). Within each state, the minimal range was $17 in Georgia versus a maximal range of $66 in Indiana. The wider value range associated with the northern and mid-western states could possibly be due to the larger number of samples tested there compared with southern states or due to weather differences (e.g., consistently drier conditions in a few states compared to others). Another reason could be the result of years of genetic (yield) improvement of cultivars targeted for the Corn Belt, due to its importance as an agricultural region.
Notably, state-to-state mean differences in SBM value and the wide SBM value range within each state, highlight the importance of local soybean producer cultivar selection. The authors fully recognize the north-to-south and east-to-west variation in cultivar seed composition; however, these results show the potential of individual producers to maximize their profit by identifying high-yielding cultivars, among those advertised by seed companies, which perform better locally, in terms of SBM value, than others in the same locality. Furthermore, seed companies could potentially utilize this simple model based on fixed ingredient prices to select, evaluate, and promote cultivars with superior seed quality characteristics. Regardless for both domestic and export markets, increasing the SBM value of the seed or meal product is a desired goal.
Evaluating the predicative effectiveness of the model for estimating SBM value
Seed yield potential is the foremost criterion in which soybean breeders have selected cultivars for advancement. Only after this criterion is met are other traits such as compositional quality considered. Until recently the quest for increased seed quality has been primarily focused on seed protein and oil content as cut-off criteria for choosing which of the high-yielding breeding lines have seed protein contents closer to the desired levels. Soybean producer organizations have promoted the use of a cut-off value for protein seed content >35% and for oil content >19% (13% moisture basis) when possible, based on the perception that doing so would potentially increase SBM value. However, by focusing only on protein and oil content minimum criteria, other important compositional information is not simultaneously considered, such as the AA concentration and digestibility of individual AAs, which could affect the animal feeding ration based SBM value in unpredictable ways. Here, we have shown that the model (Equation 1) we developed based on 4-year, 29-state set of 8,282 samples, was a reliable predictor of SBM value for evaluating SBM-specific for a desired swine ration.
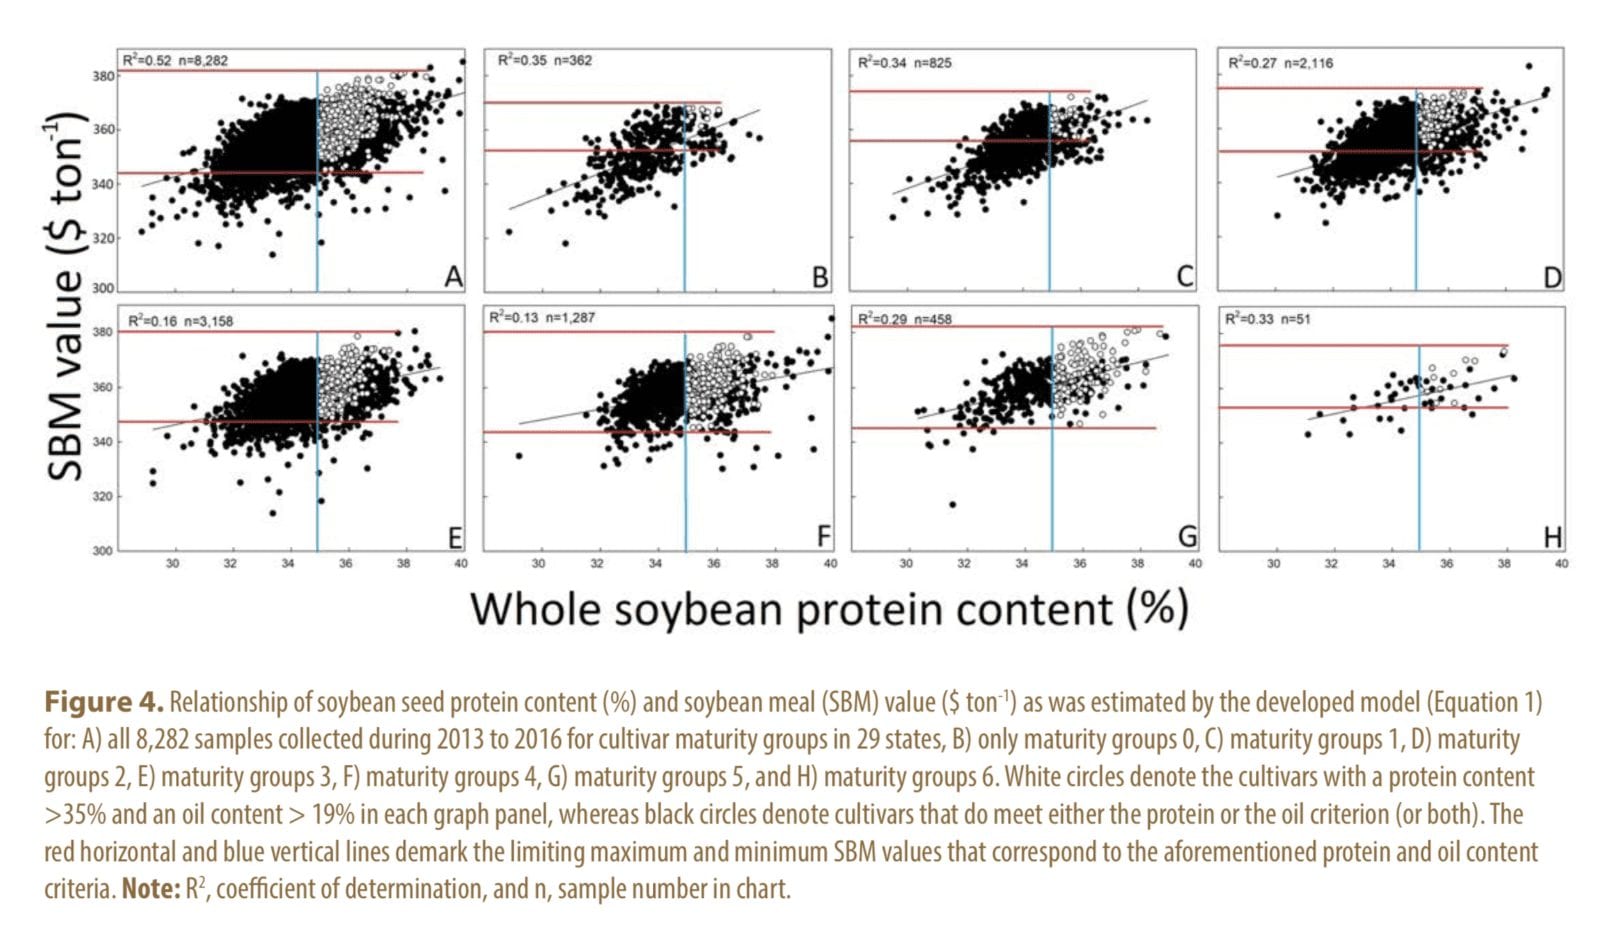
When using whole soybean protein content as explanatory variable, ca. 50% of SBM value variability was captured (Figure 4A). When using protein and oil content limits (protein seed content >35%, and oil content >19%) as the only SBM value indicator for ‘high-quality’ cultivars (white circles), the red-line-delineated SBM value range was $43 ton-1 (Figure 4a). The ‘high-quality’ samples accounted for <14% of all samples.
In short maturity groups (≤2), the ‘high-quality’ samples did not exceed 8% of total whereas, for longer maturity groups (≥3) the proportion reached 40%. Seed samples produced by cultivars that did not meet the ‘high-quality’ criteria (black circles) were also within the same value range and some exhibited an even greater value. The same response was observed when repeating the analysis by disaggregating the 8,282 samples into maturity group sub-sample sets (Figures 4B-H). Thus, one can infer from this graphical presentation that with only protein/oil content serving as a ‘high-quality’ criteria important compositional information is not fully considered.
These results suggest that using minimum protein and oil content as the only criteria for SBM value indicator, a large proportion in value variability remains unexplained. Adding other seed quality constituents, such as essential AAs that also contribute to SBM value, as we do in our model (Equation 1), will better target high SBM value cultivars, compared to just targeting cultivars meeting just a simple standard of protein and oil content greater than 35 and 19%, respectively. This is also clearly evident in the maturity group-specific graphs (Figures 4B-H). Therefore, including the AA profile along with protein content profile provides a more reliable estimate of SBM value, particularly when modeling SBM for soybean meal destined to be used in animal feeding rations.
Conclusions
The work presented here has important implications for soybean cultivar selection and breeding efforts across the U.S. Using swine diet as a case-study, we showed that when assuming constant SBM energy content, by considering meal protein content and the concentrations of four essential AAs (Lys, Meth, Tryp, and Iso), a precise estimate of SBM value can be obtained. A simple model based on fixed ingredient prices was presented that allows soybean producers, elevators, and processors to estimate the relative cultivar-specific SBM value for swine nutrition. This method can also be replicated for other, economic important, diets (e.g., poultry) and help U.S. soybean producers to select appropriate cultivars, among those promoted by seed companies as the highest-yielding, for production of greater SBM quality. Future models should value differentiation by estimating SBM energy values and layer that value alongside amino acid value differences. Ultimately, the U.S. as a whole could improve its position in the world soybean market due to the increased seed quality characteristics.
REFERENCES
Brumm, J.T., and C.R. Hurburgh. 1990. Estimating the processed value of soybeans. J. Am. Oil Chem. Soc. 65: 302-307.
Cromwell, G. L. 2000. Utilization of soy products in swine diets. Pages 258–282 in Soy in Animal Nutrition. J. K. Drackley, ed. Fed. Anim. Sci. Soc., Savoy, IL.
Kane, M.V., C.C. Steele, L.J. Grabau, C.T. MacK- own, and D.F. Hildebrand. 1997. Early-maturing soybean cropping systems: III. Protein and oil contents and oil composition. Agron. J. 89:464-469.
Lagos, L. V., and H. H. Stein. 2017. Chemical composition and amino acid digestibility of soybean meal produced in the United States, China, Argentina, Brazil, or India. J. Anim. Sci. 95:1626–1636. doi:10.2527/jas2017.1440.
Mourtzinis, S., A. Gaspar, S. Naeve, and S. P. Conley. 2017. Planting date, maturity, and temperature effects on soybean seed yield and quality. Agron. J. 109:1–10. doi:10.2134/ agronj2017.05.0247.
Yaklich, R., and B. Vinyard.