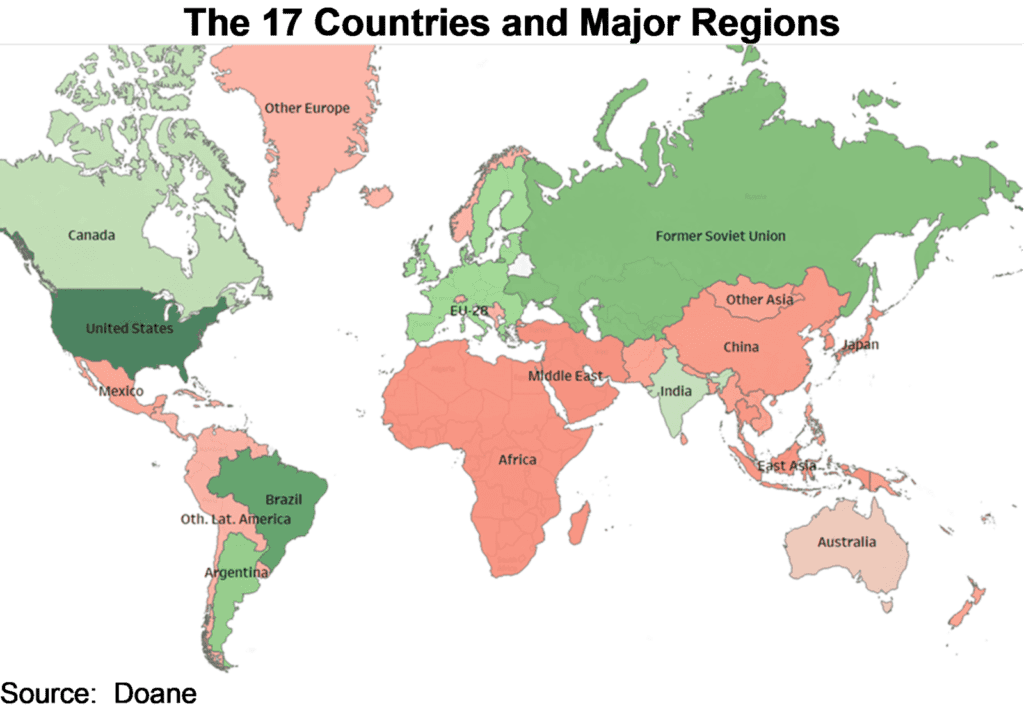
Doane’s economists recently updated the International Agriculture Outlook report, which includes ten-year forecasts of harvested area, yield, production, utilization, per capita consumption and net trade of coarse grains, corn, soybeans, wheat, cotton, and rice for 17 countries or major regions that encompass the world and are displayed below. The report distills and conveys big-picture trends found in the global data on a semi-annual basis. The following piece is focused on the world soybean market. Historical data is provided by the United States Department of Agriculture’s (USDA) Foreign Agricultural Service (FAS).
In general, the international forecast is based on the United Nations’ sourced estimates of past yearly global censuses of population combined with long-term trends for per capita consumption to estimate world demand growth. Demand must be achieved by production from a combination of harvested area and yields with long-term trade netting the differences between demand and production. (A positive value for Net Trade in the tables represents a surplus of exports to imports. A negative value for Net Trade represents imports exceeding exports.)
Over the long term, world production comes into line with world consumption and world net imports approximate world net exports. In addition, the supply side (production plus net imports) of any country or region eventually comes into balance with the demand side (consumption + net exports). The projections are designed to provide a plausible scenario for the sectors covered, but not the actual outcomes in any particular year. China is handled differently because Chinese government officials are balancing domestic farmer needs, very large ending stocks, meeting tariff rate quotas (TRQ) and other political concerns. The baseline assumption is China’s rising consumption levels will allow it to simultaneously increase imports while reducing ending stocks or returning to a more normal stocks level.
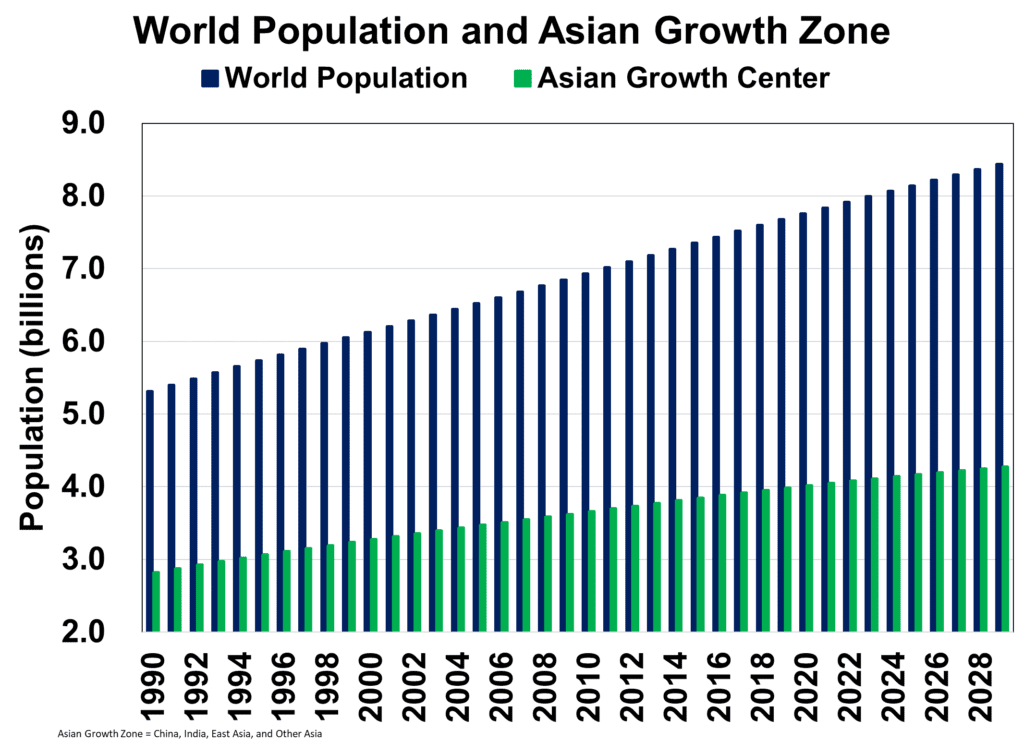
Resting in the background of the analysis are the past estimates of global population growth, both for individual countries and accumulating to the global situation. The following chart clearly depicts that global population increases in a monotonous steady upward slope. As a starting point, world population is projected to rise 9% over the next decade, which will drive consumption increases.
The major changes from the November 2019 report included the U.S. / China trade war entering Phase One of a trade deal, the COVID-19 pandemic, China aggressively rebuilding its animal operations, and energy prices collapsing. Although the trade war may never be fully resolved, a new “normal” is being discovered. The reality is the U.S. and China need each other to maintain growth in their respective agricultural economies. Unfortunately, much of the Phase One trade deal benefits are being offset by the COVID-19 pandemic, which is having a dramatic impact on the 2019 marketing year. The COVID-19 pandemic has largely sped up existing trends in the marketplace, especially related to technology. Some of the 2020 marketing year impact from COVID-19 is being offset by the Chinese government aggressively expanding its hog and poultry operations, which ensures strong corn and soybean meal consumption expansion. The trade war and COVID-19 have resulted in market players expanding and diversifying supply chains that will have long-term damage to the U.S and Chinese agricultural economies while benefiting South America, Africa, Other Asia, and East Asia.
According to China’s Agriculture Ministry, the African Swine Fever (ASF) had reduced the market hog population by roughly half. China’s meat sector has imported more meat and invested heavily in chicken operations to offset some of the lost pork production. Currently, Chinese government officials have reported they are investing heavily in world class hog operations that will quickly bring production back online. The ability of hogs to reproduce makes this very easy to do from a biological standpoint. From a financial standpoint, investing in a hog barn with a fully operational sow breeding operation is very risky without a vaccine for ASF.
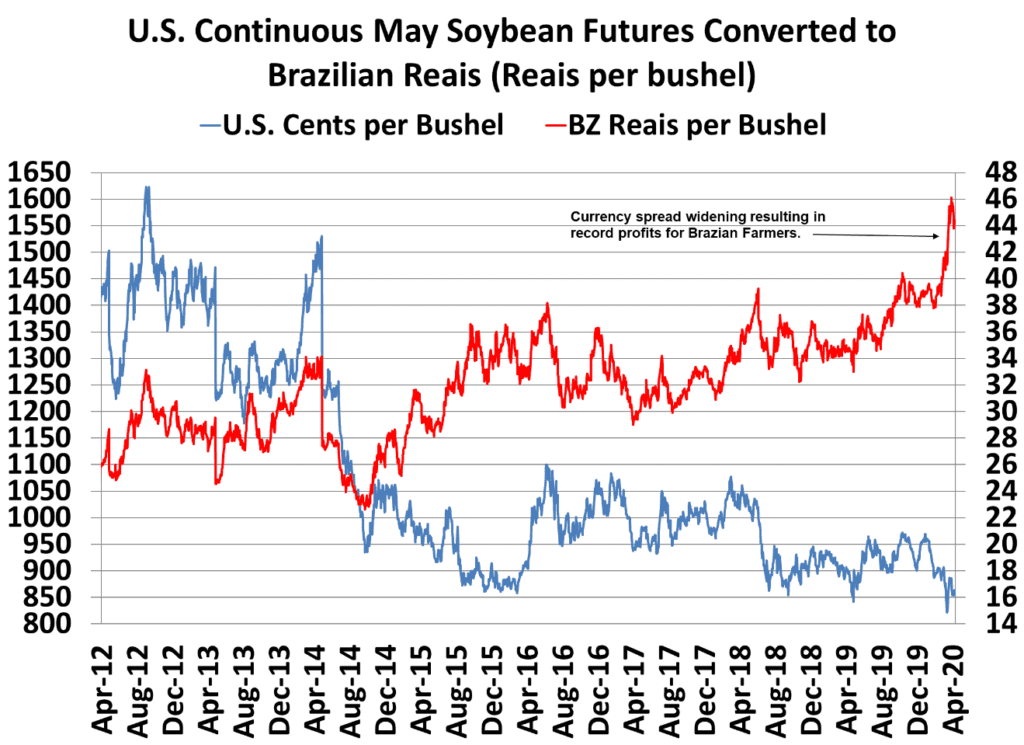
During the trade war, China implemented a 30% trade tariff that shifted significant soybean, corn, and cotton export volumes to Brazil and Argentina. The U.S. / China trade war also resulted in a flight to safety, which in turn sent the U.S. dollar to record highs versus the Reais. After Phase One, the currencies stabilized but COVID-19 sent the world traders towards the dollar and away from the Reais. The currency devalued between the Brazilian farmers buying inputs and selling the crops. Because commodities are quoted in dollars, the resulting price signal to Brazilian farmers in Reais is record high prices and profits for two straight years, which has resulted in an increase in planted area. Eventually the currency devaluation will stop or reverse, and the Brazilian farmer will lose money, but as a rule, once pasture and forest are converted to crop land, it remains in production even if commodity prices decline.
Lower commodity prices should translate into lower acreage, but world agriculture is influenced by several market distorting policies. The agricultural policies are driven by national security concerns and domestic employment concerns. No country wants to be dependent on another country for basic commodities. The U.S. / China trade war illustrates the importance of having a strategy in place. Also, world agriculture still employs a very large number of people at the farm and in downstream industries. As a result, sharp declines in price do not have the same impact on production that occurs in other industries. In fact, U.S. bringing prevent planting acres back into production and record high soybean prices in Brazil encouraging production has resulted in world 2020 harvested acres increasing by 7.6 million hectares. More importantly, agricultural production of the categories covered in the report is forecast to increase 43.2 million metric tons (MMT). The available supply of crops will allow animal operations and downstream operations to remain open and grow.
The combination of China aggressively rebuilding and transforming its animal operations’ supply chains from small backyard operations to large modern commercial operations that require higher quality feed mills at the same time the Brazilian farmer ramps up production will result in world soybean and corn consumption being much higher than market expectations. ASF and COVID-19 highlight the importance of better environmental controls and more secure supply chains. The world is demanding the Chinese improve its environmental and health standards. Implementing environmental and health standards is often a very expensive fixed cost. To this end, the modernization of the animal industries achieves several policy goals for China and the world.
COVID-19 has brought wet markets into the world’s public eye. The safety of wet markets has come into question. One area of the supply chain that is often ignored occurs from marketplace to home. The expansion of commercial animal operations increases the amount of product flowing from one location, which requires more cold storage capacity and the development of the transportation cool chain. The cool chain requires dependable sources of power. In developed countries, the cool chain is fully developed and taken for granted. Marketplaces in developing and poor countries have wet markets. A wet market is when meat taken to a venue frozen and the meat thaws over the course of the day. All over Asia, marketplaces are converting from a wet market to a refrigerated store. Homeowners are investing in refrigeration, which allows them to buy more meat and vegetables on each trip to the market.
A long-term impact of the trade war and COVID-19 is that all market players in the international community are developing new supply chains that reduce dependency on any one country. To this end, a tremendous amount of infrastructure investment has occurred in the Asian Growth Center and Brazil. Examples of supply chain investment are new ports, deeper ports that can handle larger vessels, railroad tracks that service the ports, more sophisticated grain storage systems, and commercial animal operations.
Due to a dramatic drop in crude oil prices, major energy surplus countries are expected to have significant decline in meat consumption. Because the Middle East is a significant net importer of food, any decline in consumption requires lower prices to clear the market.
China and the U.S. concluded their historic Phase One agreement to buy more U.S. agricultural products and lower nontariff barriers. Market players have expressed interest in exporting more U.S. agricultural products to China, but the definition of what is included in the Phase One is vague. There is some question of whether agricultural imports include inputs, such as fertilizer, chemicals, seed, and equipment. Even if it does include inputs, China importing $40 billon of U.S. agricultural and related products in calendar year 2020 will be challenging with COVID-19 lowering consumption. The $40 billion represents an increase of $16 billion over the record import level. The historically low commodity prices afford China an opportunity to quickly take a big step toward meeting the Phase One requirements while not being forced into purchases at higher prices. Two words China used repeatedly in all correspondence during the trade negotiations were “market driven.” The purchases are market driven given the plunge to multi-year lows in commodity prices.
Another interesting sidebar is the question surrounding the possibility of including Hong Kong’s imports of U.S. agricultural and related products in the Chinese totals. Including Hong Kong could reduce the import total by a third. Hong Kong has a population of 7.4 million compared to 1.4 billion for China in 2017. It defies logic to assume that Hong Kong itself is importing $1 billion of tree nuts for its own consumption. Most of the Hong Kong imports are transshipped to the mainland and could easily be reclassified as additional Chinese imports from the U.S. when the tax laws change.
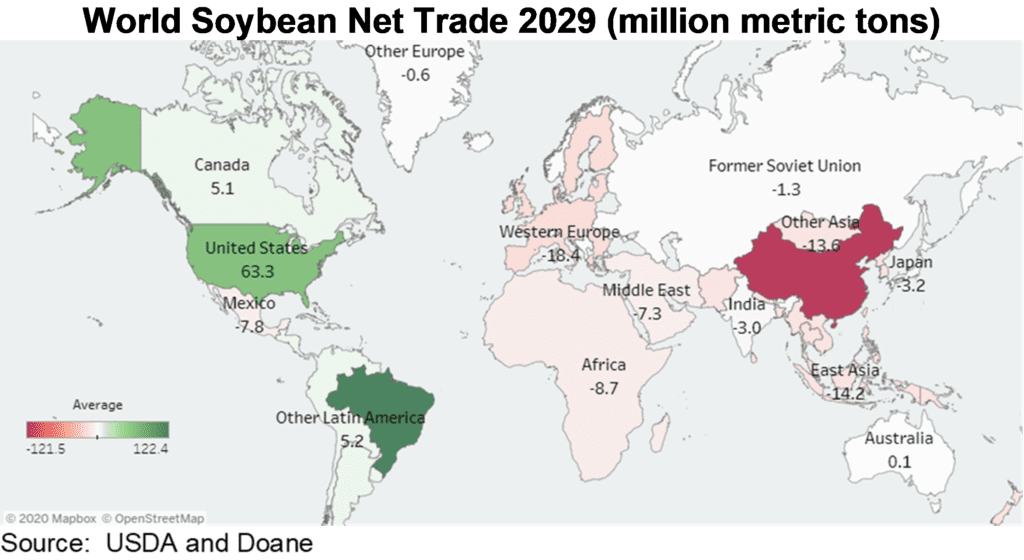 The Asian Growth Center of China, India, Other Asia and East Asia is experiencing great growth in food consumption but has limited acreage available for cultivation. The Asian Growth Center accounts for 52% of the world population. The area consists of extreme poverty that is enjoying economic growth, which is very important for commodity consumption but especially food products because as income increases, a wealthy person responds by switching to high-end food products, eating at restaurants and could even hire a chef. Although they are spending more money on eating, the volume of coarse grains, wheat and protein meals consumed might not increase. By comparison, as income increases, a poor person responds by adding ingredients to a basic diet. Eating tastier food often requires vegetable oil, meat, fruits and vegetables. Meat production requires feed rations of grains and protein meals that is converted into weight gain. For example, if 1.6 pounds of feed is required to add 1 pound of chicken, switching or just adding chicken to the dish results in an increase in per capita consumption (PCC) of grains and protein meals. As meat consumption increases, a natural evolution is from backyard operations to commercial operations to gain economies of scale. ASF and COVID-19 are accelerating the trend towards commercial animal production, which will increase use of commercial feed rations. Commercial operations are more efficient at converting feed rations into meat due to feed rations that are more precise. The feed ration requires exact nutritional requirements that come from grains and soybean meal versus table scraps. Global soybean trade is projected to 210 MMT in 2029 compared to 152 MMT in 2020.
From 2010 to 2019, the Asian Growth Center PCC increased 42% for soybeans. The increase was driven by increased population, increased personal income, and India’s younger population more willing to eat meat. From 2020 to 2029, PCC is forecast to increase 33% for soybeans. With food consumption growing faster than production in the Asian Growth Center, the area will continue to be grain and soybean deficit. As consumption increases over time, trade also increases. From 2010 to 2019, Asian Growth Center imports of soybeans increased 74% and over the next ten years, imports of soybeans are forecast to increase 41%. The reasons for the percent slowdown are a much larger starting level, national security concerns limiting imports, and pulling more acres into production requires overcoming environmental concerns and higher price levels that reduce consumption.
With per capita consumption (PCC) still well below the developed countries, the consumption rate could be much higher depending on what level of imports China allows. Does being self-sufficient mean no imports or not being to dependent on any one country? China’s government policy of providing incentives to quickly rebuild and expand the hog industry while allowing the poultry industry to expand points to China allowing more grain and soybean imports.
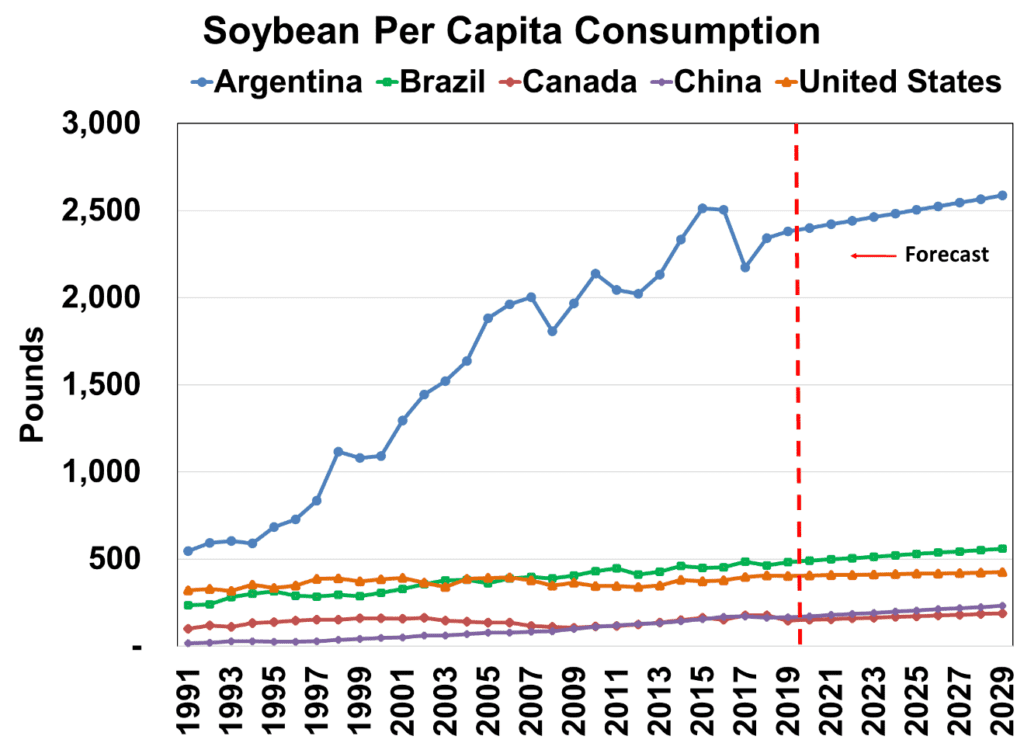
Soybean world PCC averaged 43 pounds in 1990. By 2000, that had increased to 62 pounds, up 42%. China’s consumption grew strongly during that decade before it began its massive soybean import program. However, China’s PCC was only 19 pounds in 1990 compared to the U.S. at 304 pounds. By 2000, China’s PCC was at 47 pounds whereas the U.S. was at 383 pounds. Argentina and Brazil also saw outstanding growth in the 1990s. Argentina increased from 502 pounds to 1,091 pounds. Brazil’s gain was from 226 pounds to 310 pounds.
The years 2000 to 2010 found world PCC increasing from 62 pounds to 81 pounds despite the U.S. decreasing from 383 pounds to 344 pounds. The decline in U.S. PCC is easily associated with the competition of distillers dried grains that competed on price with soybean meal. Argentina’s PCC jumped from 1,091 pounds to 2,135 pounds. Brazil went from 310 pounds to 436 pounds. China at 47 pounds in 2000 advanced to 110 pounds.
The forecast for world PCC use over the next ten years from 2020 to 2029 increases from 102 pounds to 120 pounds or an 18% increase. For these same years, the Argentine forecast advances 8%, Brazil by 14%, China by 33%, and the U.S. by 9%. After a pause in 2018 and 2019, China’s PCC is expected to roar back as domestic animal operations are aggressively expanded.
In 2020, Zeeland Farms Soya opened a 3,425 ton per day plant in Ithaca, Michigan. As the Corn Belt continues to expand, more crushing plants will continue to emerge. The northern and western Corn Belt expansion has resulted in farmers located in the expansion areas receiving deeply discounted soybean prices while the animal operations receive expensive soybean meal. With a soybean crushing plant providing local consumption, soybean basis should improve and encourage more local soybean production. Likewise, the availability of local soybean meal should lower the cost of animal feed and encourage more animal production.
Agydsa is building a new plant in Jalisco, Mexico with a crushing capacity of 4,000 metric tons per day, which is expected to become operational in August. A 4,000-metric ton per day crushing plant will require Mexico to increase imports to 1.4 million metric tons annually.
The plant will reduce the need for some soybean meal imports but will support the Mexican animal operations. As was learned during COVID-19 and the U.S. / China trade war, the diversification of the supply chain is very important. During time periods that involve trade restrictions, such as trade wars and disease issues that prevent meat exports, having multiple buyers is advisable.
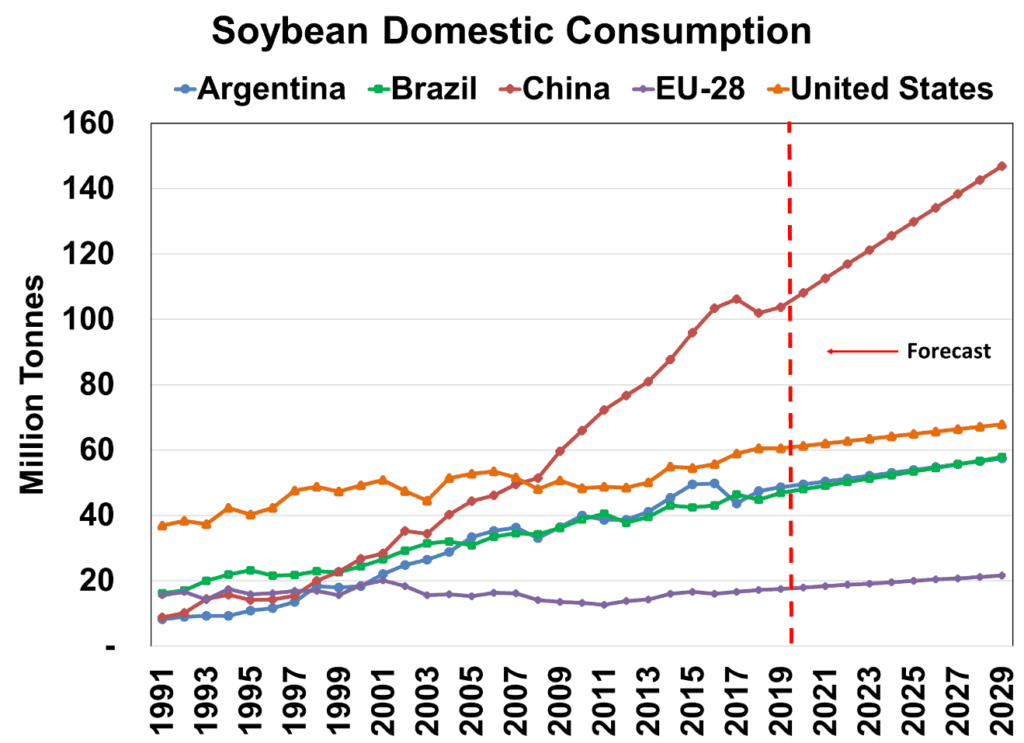
The domestic utilization forecast is derived from population and per capita forecasts. As noted above, population is projected by UN calculations to increase by 9% to 2029. Global soybean utilization is estimated at 359 MMT in 2020. No surprise that China is the largest constituent of the total at 108 MMT. The U.S. comes in second at 61 MMT. Argentina and Brazil are nearly identical at 50 MMT and 48 MMT, respectively. The four-country total is 267 MMT or three-quarters of the global utilization total. The world outlook for 2029 totals 460 MMT, which represents an increase of 28%.
In the forecast period, China remains the dominant user at 147 MMT or a gain of 36%. For reference, between 2010 and 2019, China soybean use surged 57%. The Asian Growth Area experienced a 51% increase from 2010 to 2019 and is forecast to increase 37% over the next ten years.
The global soybean yield increase over the past decade was 9% and the next decade is expected to be 7%. Corn and soybean yield inputs are enjoying a tremendous amount of research and development money that could push the yields higher than forecasted.
South America and Africa have the most land available to enter crop production, but South America is best suited to add the quantity of land required to meet an expanding world food consumption. Although Africa is often targeted for investment due to its available acreage and inexpensive workforce, the investments have not had a significant impact. Nonetheless, Africa needs to be monitored closely for three additional reasons. By 2028, Africa may exceed China for the largest population. The population expansion is driving the need for more commodities. The trade war and COVID-19 have companies more determined to develop alternative supply chains. Environmental concerns call into question Brazil’s ability to continue to expand acreage.
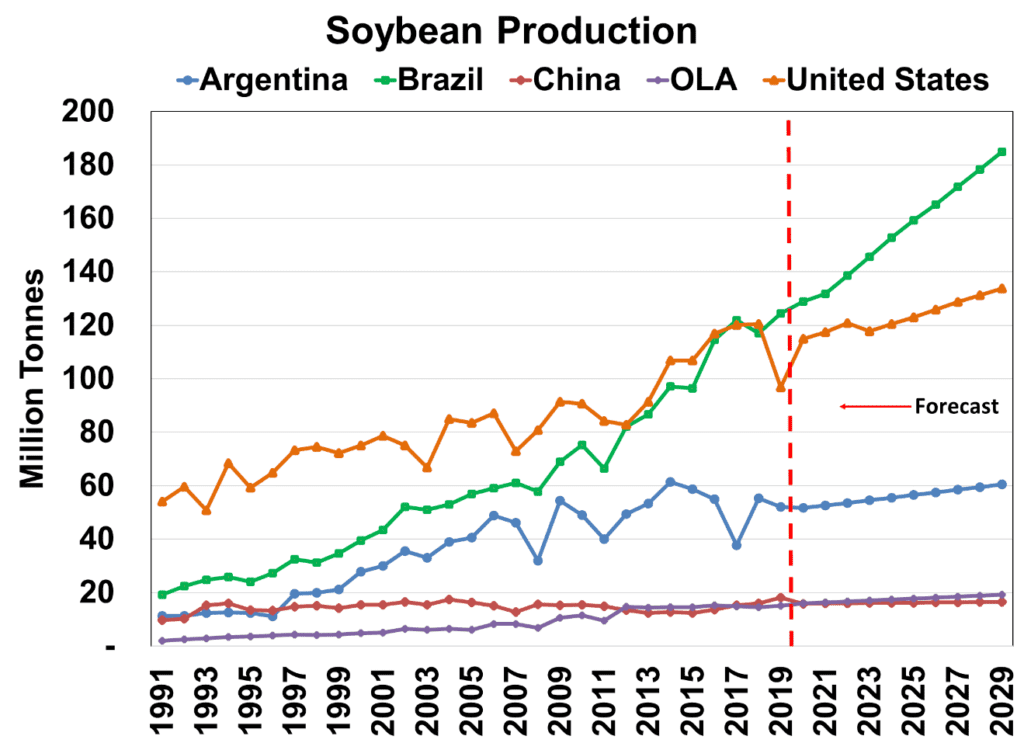
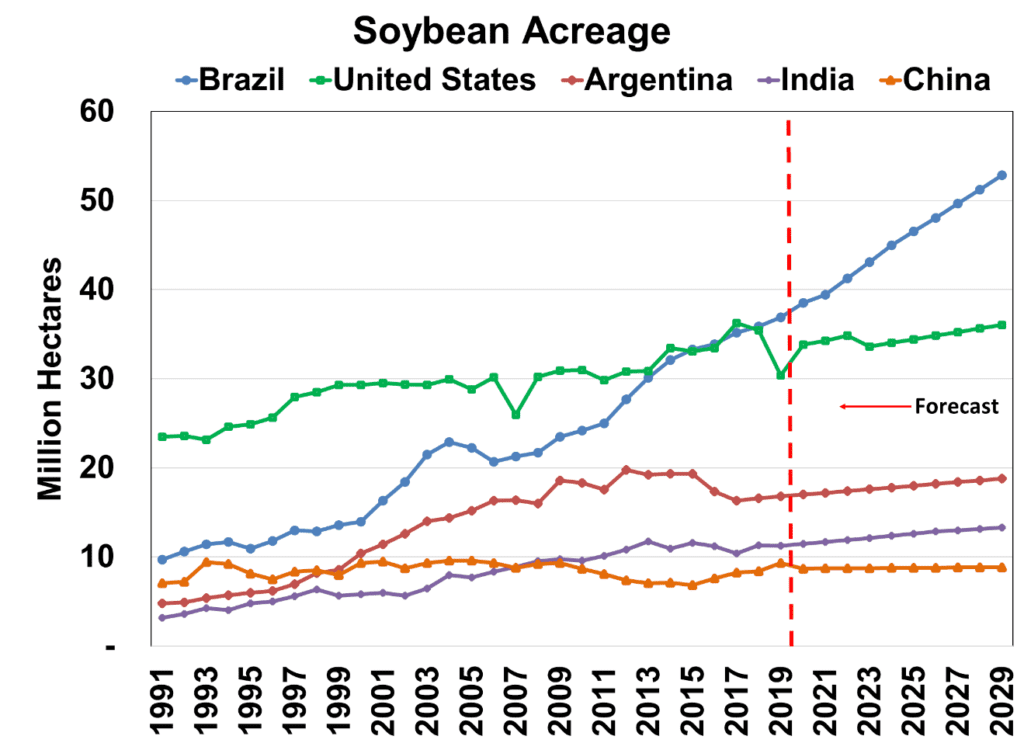
Soybeans’ past strength in the soybean production components and the anticipation that this leading protein meal source will experience strong gains in the outlook. The latest forecast for 2020 area is 127 million hectares. By 2029, the area forecast is expected to be 151 million, a gain of 18%. The increase in soybean acreage between 2010 and 2019 was 18%.
From 2010 to 2019, world soybean production increased to 338 MMT or an increase of 27%. The projection between 2020 and 2029 is for production to reach 458 MMT or increase by 27%.